Fast Fatigue
TESTING TECHNOLOGY
FFTT is built on the Risitano Thermographic Method and the Static Thermographic Method, and it is equipped with thermographic (IR) sensors and digital image correlation (DIC). It delivers the Wöhler curve and the fatigue limit in under 48 hours.
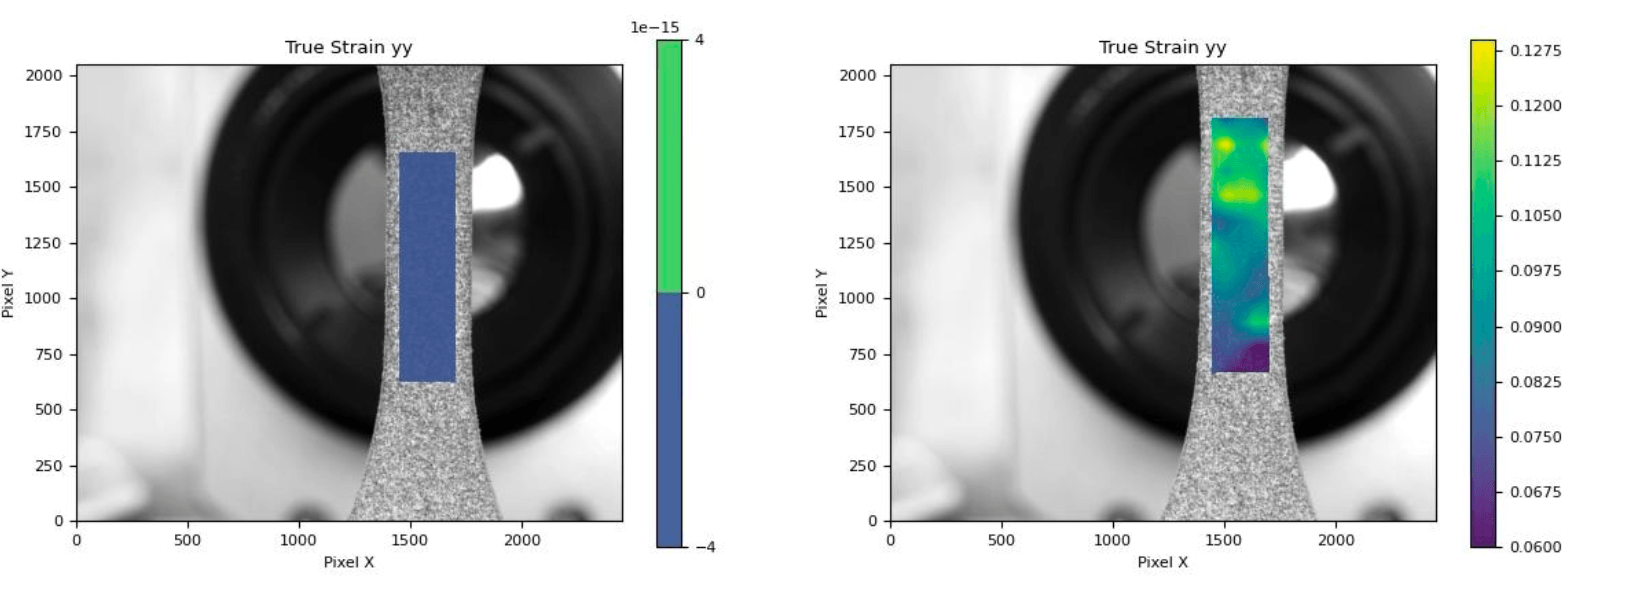
IR Camera
Infrared Thermal Imaging
Tracks the evolution of the specimen surface temperature during the fatigue test.
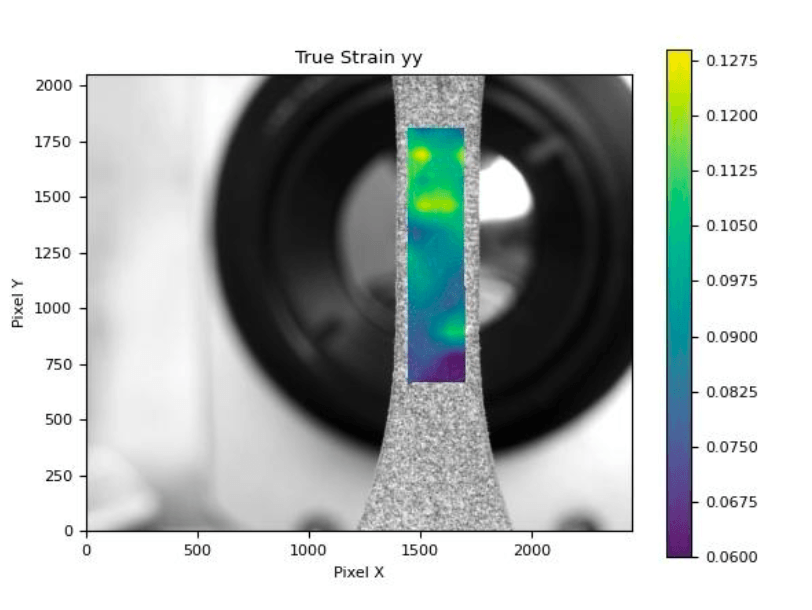
Digital Image Correlation
Strain field
Measures specimen deformation during mechanical tests.
Static Thermographic Method
First-damage limit
Estimation of the limit stress that triggers the first microplasticization of the material.
Risitano Thermographic Method
Wöhler curve and fatigue limit
Derivation of the Wöhler curve and the fatigue limit by analyzing the stabilization-temperature trend as a function of the applied stress level.
An integrated technology
IR Camera
Infrared Thermal Imaging
Tracks the evolution of the specimen surface temperature during the fatigue test.
Digital Image Correlation
Strain field
Measures specimen deformation during mechanical tests.
Static Thermographic Method
First-damage limit
Estimation of the limit stress that triggers the first microplasticization of the material.
Risitano Thermographic Method
Wöhler curve and fatigue limit
Derivation of the Wöhler curve and the fatigue limit by analyzing the stabilization-temperature trend as a function of the applied stress level.
FEW DATA POINTS GIVE AN ILLUSION OF PRECISION.
MORE DATA GUARANTEES TRUE RELIABILITY.
Series 1 has the best R² — and it is the least reliable.
ASTM E739
The ASTM E739 standard recommends a minimum of 12–24 specimens for statistically meaningful campaigns. Below that threshold the result can only be regarded as indicative characterization, not design-grade reliability. The ASTM E 739 range is purposely wide to reflect a low-high reliability band. Scientific literature on fatigue characterization, together with several decades of industrial application, points to 20 specimens as the practical threshold below which survival-curve estimates become too uncertain to support reliable design decisions. It is not a regulatory rule, but a well-grounded engineering threshold.
Materials fatigue:
a deep, little-known field.
The most common mistake: 5 specimens are not enough
One of the most widespread mistakes is working with Wöhler curves derived from just 5 specimens. The difference compared to 20+ specimens is not quantitative — it is qualitative. 5 specimens are insufficient to estimate a distribution, they only allow curve fitting on a sample that is just too small: it is comparable to estimating a city’s annual rainfall by measuring only 5 summer days.
With traditional methods, 20+ specimens make it possible to build a P-S-N curve (Probability-Stress-Number of Cycles): the family of iso-reliability curves at 5%, 50%, 95% on which robust design decisions are built. FFTT enables to reach the same result with a handful of specimens, in under 48 hours.
Fatigue evaluation of a
naval structural steel.
A comparison between the traditional method and our solution.
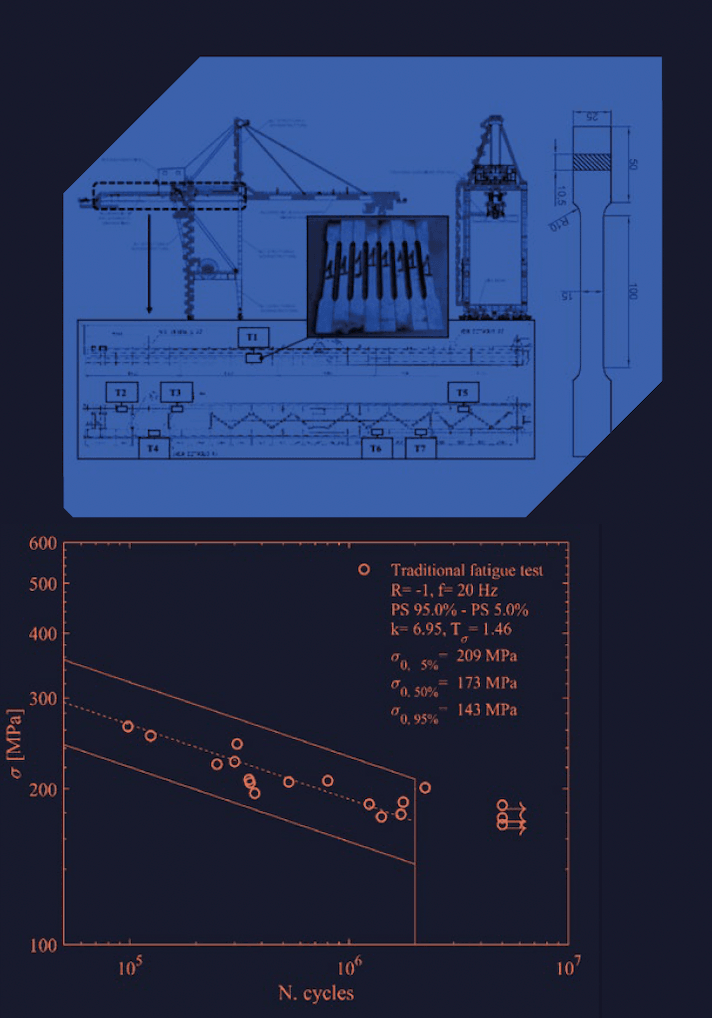
S-N curve with scatter band obtained through traditional fatigue methods.
Test time: about 500 hours
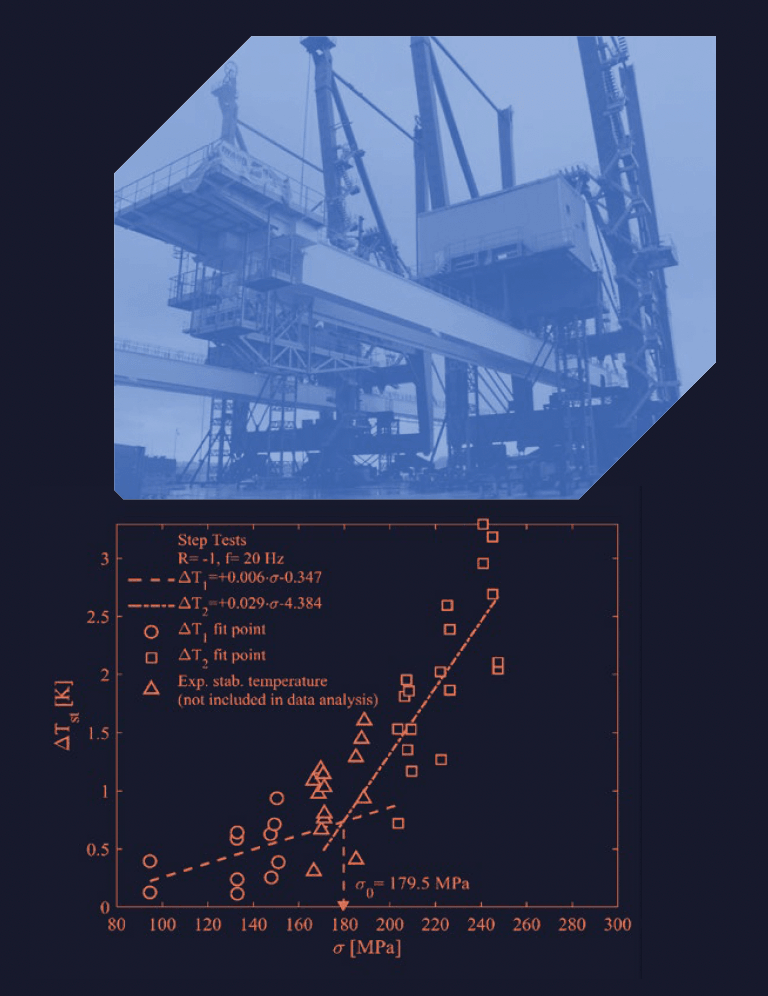
Fatigue limit evaluation via the thermographic method.
Test time: about 8 hours
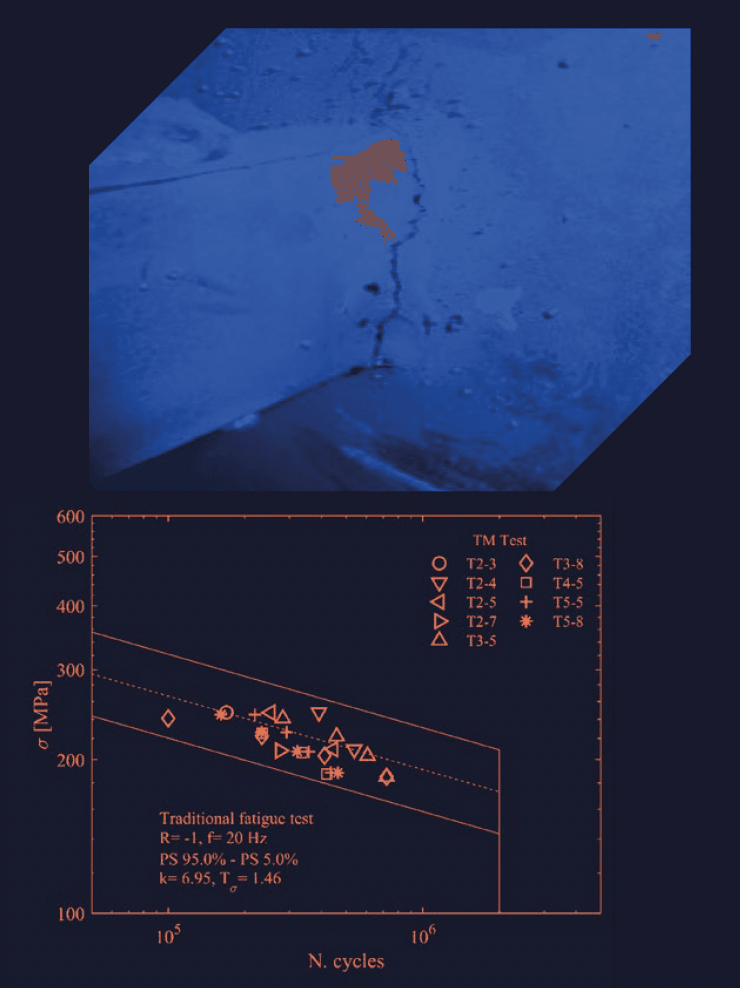
Comparison between the S-N value obtained from stepwise testing via the thermographic method and the scatter band of traditional fatigue tests.
